|
An article published today in the Cork News newspaper (available here) which features an interview with me on the introduction of the new household charge of €100. In the article I outline how it is a regressive tax and the proportionately harder impact it will have on the poorer members of society.
2 Comments
I have just taken part in an interview on the Muiris Walsh programme on TipFM relating to the introduction of the new €100 Household Social Charge. The discussion revolved around the social implications of the charge, whether it would increase in coming years and the recessive nature of the charge. TipFM do not have a pod-cast so it is not possible to provide a link tot he interview.
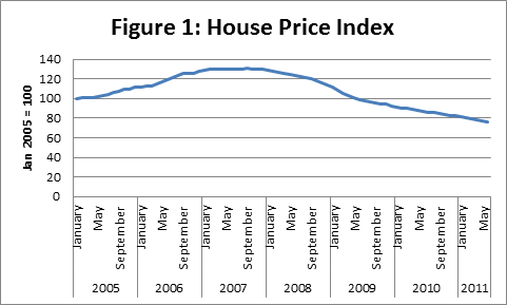
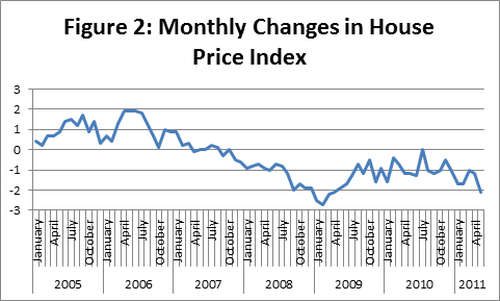
The latest figures from the CSO show that property prices are continuing to fall in the Irish economy. Figure 1 shows how they have declined from their peak value in 2007 to their current low in June 2011. The continual fall in house prices will continue to have negative implications for mortgage holders, who will see the value of their property continue to fall while they go further into negative equity. While the price of housing is continuing to fall there has been a slight slow down in the rate of this fall as displayed in Figure 2. We can see that recently the rate of decline has been in the region of -1 to -2 percent. This might have given some hope that the worst of the decrease was over, however, in June the decline broke past the 2% mark to reach a value of -2.1%. Overall the decline from June 2010 to June 2011 in house prices has been -12.9%.
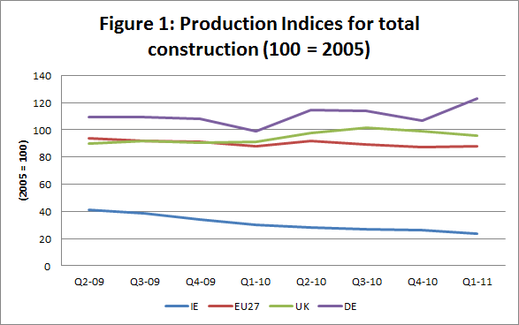
In quarter 1 of 2011 Ireland’s construction output continued to fall. Figure 1 shows Ireland’s construction output against the EU27, our closest neighbour the UK and Germany. It is clear to see that Ireland’s construction output has been hit much harder than the EU average and our neighbour the UK. Ireland’s output is only 23% of what it was in 2005 (which was not even the peak of the construction bubble). While the UK suffered a decline in construction over recent months it has increased to 2005 levels and more or less maintained these levels, with a slight fall in Q1 2011. The EU average in also holding steady at about 90% of the output of 2005. Slight seasonal fluctuations can be observed in the trend but that path is remaining fairly stable. Germany is beating the downward and constant trend, with increases in construction output. It is now producing at about 20% above 2005 levels. These figures highlight the continuing dismal state of the Irish construction industry. And worryingly, as quarter on quarter declines are still being observed, we appear to not have bottomed out yet.
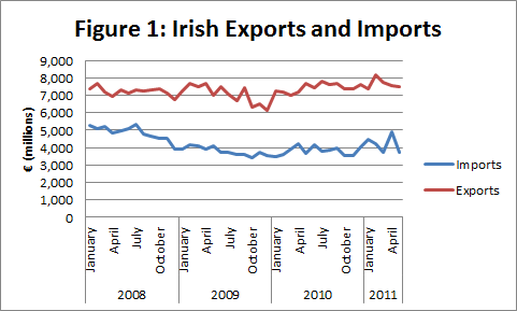
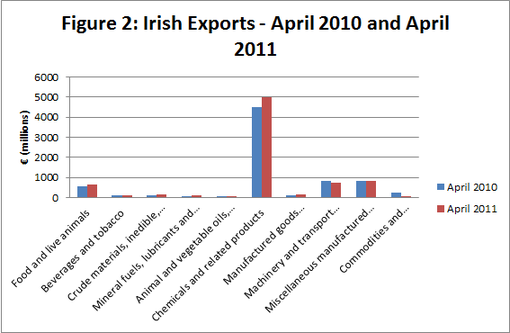
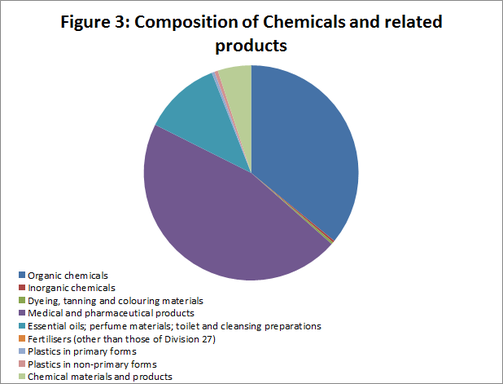
Seasonally adjusted exports have remained static while imports have decreased by 24% (or €1,200m) between April and May 2011. This has resulted in a widening of the trade balance €3,783 million (as can be observed in Figure 1). Relative to April 2010, we can see Ireland’s export growth and stabilisation over the past year has been cantered predominately in one area. The Chemical and Related Products sector accounted for 61% of exports in April 2010 and this has increased to 64% of exports in April 2011. These figures show the dependence of Irish exports on one broad sector, indicating a lack of diversity in our export portfolio. If we look in greater detail at the Chemical and Related Products sector it is clear that even within this category it is a relatively small number of sectors which is driving exports. Figure 3 displays the contribution of the various sub-components of the Chemical and Related Products sector to exports. It is clear to see that Organic Chemicals and Medical and Pharmaceutical Products make up for the majority of Ireland’s exports in the Chemical and Related Products sector. In total these two sub-components account for 82% of Ireland’s exports in Chemical and Related Products and 52% of our total exports. This shows the dependence of Ireland’s exports on two specific sectors which are mainly comprised of multinational enterprises. A shock to either of these two sectors could have serious implications for Ireland’s “export lead recovery”.
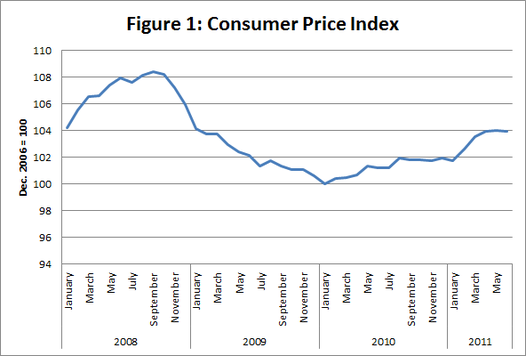
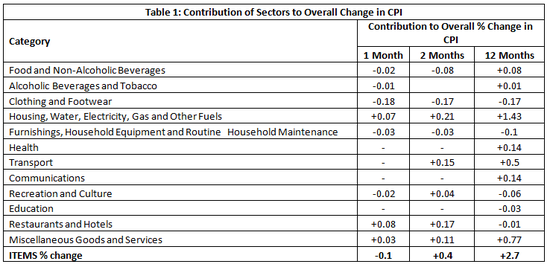
The latest data from the CSO indicates that in the year to June prices have increased by 2.7%. Consumer Prices in June, as measured by the CPI, decreased by 0.1%. However, Prices on average, as measured by the CPI, were 2.7% higher in June 2011 compared with June 2010. This can be observed in Figure 1, where we can see prices slowly climbing again after they bottomed out at the start of 2010. Table 1 Shows the underlying changes which have caused the 2.7% increase in the year to June. It can be observed that increases in the price of Housing, Water, Electricity, Gas and Other Fuels has been the largest contributor to the 2.7% increases, contributing accounting for over half of the total increase in the 12 month CPI (from June 2010 to June 2011). Following this Miscellaneous Goods and Services has also increased, contributing close to 30% of the increase in the 12 month period. Other increases in Health and Communications have been relatively small. Any of the categories which have fallen in price have seen a relatively small decreases. Clothing and Footwear saw the biggest decrease (which was only -0.17%) followed by a slight decrease in Recreation and Culture. Overall, the trend appears to be rising prices in most sectors, with only a small few sectors still seeing price decreases.
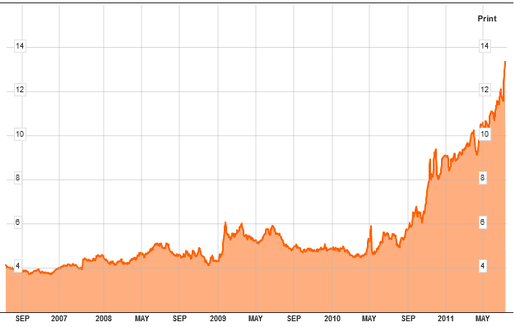
Ratings agency Moody's has downgraded Irish debt to "junk" status. What does this mean? Effectively it means that the rating agency believes that Ireland will default on its debt. Basically, not paying back money to individuals who had taken out government bonds. As is predictable with a down grade the yields on Irish government bonds rose dramatically, reflecting this increase in the perceived risk of Irish bonds. Below is a graph taken from Bloomberg which shows the yield on Irish 10 year government bonds. We can see the yield approaching 14% in recent days, with a large spike on the day of the announcement by Moody's. This announcement has been widely condemned by the EU, but from an Irish perspective it may place more pressure on the EU to provide additional funding and attention to Ireland over the coming weeks and months. It makes it practically impossible for Ireland to return to the bond market due to the very high yield that would be required to entice investors to hold Irish bonds.
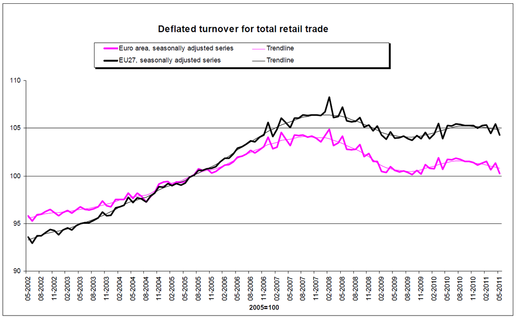
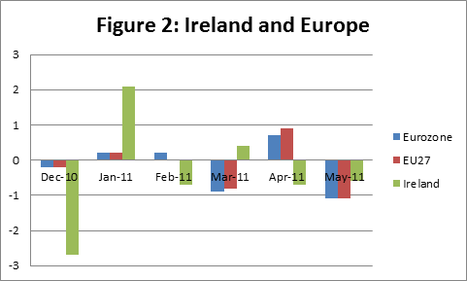
The latest figures from EuroStat indicate that the volume of retail trade has fallen in the Eurozone by 1.1% in May 2011. This is despite showing signs of recovery in April. This can be observed in Figure 1. The EU27 also suffered a drop of 1.1% in May. When we compare Ireland’s performance with that of the Europe in Figure 2 we can see that Ireland’s fluctuations are far more severe than our European counterparts. While Ireland saw a drop of over 2.5% in retail sales in Dec 2010, Europe saw a fall of only about 0.2%. When Ireland rebounded strongly in Jan 2011 with 2.1% growth, Europe only experienced 0.2% growth. These extreme fluctuations, coupled with an unpredictable positive/negative trend make it hard to judge whether Ireland’s retail sales have bottomed out. April and May of 2011 both show drops in retail sales. Overall, this is not a positive sign for retailers, who have continued to see declining sales.
|
AuthorJustin Doran is a Lecturer in Economics, in the Department of Economics, University College Cork, Ireland. Archives
December 2017
Categories
All
|
 RSS Feed
