A lack of growth for 2011 if worrying from the Irish government’s perspective as positive growth in 2011 was forecast for bank stress tests and for the expectation of reducing the government deficit to 3% by 2015 at the latest.
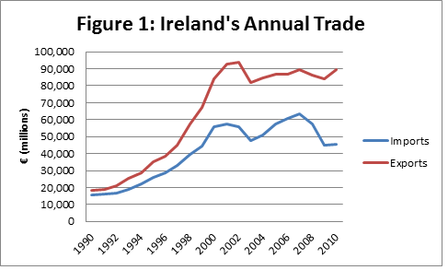
The OECD’s latest Economic Outlook on Ireland highlights the continuing problems associated with the Irish economy. They note that while exports have been preforming relatively well, the domestic economy is still in decline. Since 2007, GDO has fallen by over 14%. Government cuts are having a substantial impact on the contribution of both government spending and investment to GDP. Likewise domestic consumption has continued to decline with individuals choosing to save and pay down debt. All these factors contribute to the week domestic situation. Unemployment has risen towards the end of 2010 to approximately 14.7%. However, the outlook is not all bad as can be seen in Figure 1 below. 
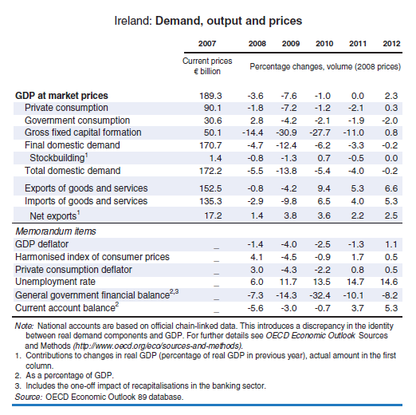
Figure 1 is taken from the OECD’s economic outlook available here. We can see how declines in private consumption, government consumption and investment have all declined sharply over the course of the last three years. While exports, and recently imports, have bucked this trend. For 2011, the OECD is forecasting that Ireland will stagnate (i.e. have a growth of zero). They now expect a recovery not to occur until 2012, where they forecast GDP growth of 2.3%. This recovery they envisage being driven by strengthening private consumption and investment with exports continuing to grow.
A lack of growth for 2011 if worrying from the Irish government’s perspective as positive growth in 2011 was forecast for bank stress tests and for the expectation of reducing the government deficit to 3% by 2015 at the latest.
1 Comment
A recent survey by the CSO on the availability of credit for businesses has shown that the access to bank loans has fallen from 95% to 55%. This dramatic drop is highlighted in Figure 1. Figure 2 gives the results of why enterprises were refused loans. Surprisingly, the number of loans refused due to poor credit ratings are actually lower in 2010 than in 2007; likewise for lack of capital and insignificant or risky potential. However, the main reason for more refusals appears to be due to enterprises already possessing too many loans/debts. Also, there has been a dramatic increase in the number of cases which have been refused with no reason given for the refusal. These results appear to conform to what would be widely reported in the media; that access to capital from the banks has been reduced.
Ireland’s exports have decreased slightly in March 2011 compared to February, but the trade surplus has increased following a decline in imports. Figure 1 shows how Ireland’s trade surplus has been historically widening since the Celtic Tiger period of economic growth from the early 1990s onwards. This has continued to widen in 2011 as shown in Figure 2. The fall of 6% in monthly exports between February 2011 and March 2011 was offset by a fall in imports of 15% over the same time horizon. This resulted in a 3% increase in Ireland’s trade surplus in March 2011.
The latest figures released from Eurostat indicate that Ireland’s construction demise has been among the worst of all the EU-27 countries. Figure 1 shows this decline compared to the European average and some other selected countries. Using 2005 as the base year of 100, Ireland’s construction output has fall by 73%. This fall is far in excess of the European average which has seen a fall of only 13%. And while the Euro Area has been more adversely effected than the rest of Europe this has only fallen by 18%. Germany’s construction output is actually higher in Q4 2010 than in was in 2005 while the UK has seen improvements in construction output throughout 2010. These figures indicate that while Ireland is not the only country to be adversely effected through a collapse in the construction industry, we appear to have suffered more than most. Perhaps indicating the extent to which the construction industry in Ireland had overheated.
In light of the visit by the Queen to Ireland it is interesting to consider the interconnectedness of the Irish economy and the economy of the United Kingdom (UK). In terms of visits to Ireland by people from the UK we can see in Figure 1 that this has been increasing steadily from the mid-1980s (with the usual seasonal variation associated with tourism). However, must likely due to the recession this upward trend has been slightly abated since 2008. In terms of merchandise trade, Ireland is also becoming more interconnected with the UK (see Figure 2). Since the 1970s our trade with the UK has increased exponentially, peaking during the end of the 1990s at the height of the Celtic Tiger and declining slightly during the construction bubble phase of the economy. However, despite this decline in the latter part of the last decade, the UK remains Ireland’s largest export market. These two graphs are just an example of the interconnectedness of Ireland with our nearest neighbour and show how important the UK economy is for the Irish economy as a customer base for our tourism industry and also as a destination for our exports.
The total number of new car sales in April 2011 was 11,171, up 15.1% from 9,599 in April 2010. As can be observed in Figure 1 there has been a month on month continual increase in new car sales in 2011 compared to 2010 and 2009. However, April 2011 new car sales are still 36% lower than they were in 2008 and 48% lower than they were in 2007. April new car sales are also lower than January, February and March car sales. This is typical given the seasonal variation associated with car sales in which most purchases occur at the start of the year.
Being from Ireland, it is hard to escape the emphasis that is placed on the importance of external trade for economic growth and prosperity. But at an aggregate levels who do the EU trade with and who contributes the most to European trade? We can look at the EU in two ways when considering trade. Firstly, we can look at the part of the EU which is within a monetary union. These countries, 17 in total, share a common currency (or are pegged to the Euro). Trade outside of the common currency zone includes not only non-EU countries but also members of the EU who have chosen not to adopt the Euro. Secondly, when considering EU trade we can look at the whole EU-27 countries as a whole. When looking at Euro-area external trade Figure 1 displays the EA-17 main trading partners. It can be seen that approximately 33% of EA-17 exports go to the UK and that the EA-17 imports almost 26% of its goods and services from the UK. These figures are closely followed by the US. However, the main external partner which the EA-17 import from is overwhelmingly China, with the EA-17 importing almost 36% of their goods and services from China. When considering the EU-27 as a whole we can see the dominance of three external partners; the US, China and Russia. The US is the largest market for the EU-27’s exports but the EU-27 imports the most from China. Indeed, the EU-27 imports almost as much from Russia as they do from the US. Figure 3 shows the proportion of trade (both exports and imports) which originate from each country. It can be observed clearly that Germany is the key driver of EU trade, exporting and importing the largest amounts to/from outside the EU-27 countries. This is followed closely by the UK, Italy, France and the Netherlands. Looking at Ireland, even though trade is of huge importance to our domestic economy, when compared to some of the larger EU-27 countries, in terms of magnitude our exports and imports are miniscule.
The latest index of house prices released by the CSO shows that house prices have continued to fall up to the end of March 2011. This decline has shown no slowdown with prices falling by an average of between 1% and 2% a month from their January 2005 price. While someone who purchased their house in January 2005 could have sold it at the height of the boom for an average price increase of 30.5%, the property is now worth an average of 21% less than the 2005 price paid. This is highlighted in Figure 1 below. Interestingly, when you look at Dublin versus the rest of Ireland it is possible to see that while prices rose faster and higher in Dublin prior to 2007, post recession prices have fallen faster and lower than the rest of Ireland. This may be due to the excessive development of apartment complexes in the Dublin area during the construction bubble, providing a large degree of excess supply which would have to be absorbed before prices begin to rise again.
Ireland is not the only country experiencing a decline in the construction industry. The latest figures released by the Office of National Statistics in the UK suggest that in the first Quarter of 2011 construction output fell by 4%. This is somewhat expected given the typical seasonal deviations in the construction data. And the figure is less worrying when noting that output in Q1 2011 is 3.4% higher than output was in Q1 2010. Suggesting that there may be signs of a tentative recovery in output in the sector. However, it is still substantially below the levels observed at the height of the industry in 2007. Figure 1 shows how, over the last few years, construction output has declined dramatically but in recent quarters is displaying something of a recovery. This is dramatically at odds with what is occurring in Ireland where construction output has been in a continual downward spiral. It can be noted that while in 2009 output floundered throughout the year, following a continual decline in 2008, from Q1 2010 improvements were observable in the output of the industry. This peaked in Q2 and Q3, as would be expected given the highly seasonal nature of this industry. The decline in Q4 2010 and Q1 2011 are likely the result of this typical seasonal variation and when figures are released in three months time for Q2 2011, provided that there is no major shock to the industry, it would be expected that the output would rise again. It will be interesting to observe however whether the output rises above that experienced in 2010 or whether, year on year, the seasonal peaks will be lower.
The BBC has produced an interactive map of some economic indicators for various EU countries. These are available here.
|
AuthorJustin Doran is a Lecturer in Economics, in the Department of Economics, University College Cork, Ireland. Archives
December 2017
Categories
All
|