Justin Doran
  • Home
  • Research
  • Teaching
  • Teaching Resources
  • ebook
  • Links
  • Contact
  • Media
  • Blog
  • RePEc

Slight Increase in Live Register Figures

6/29/2011

0 Comments

 
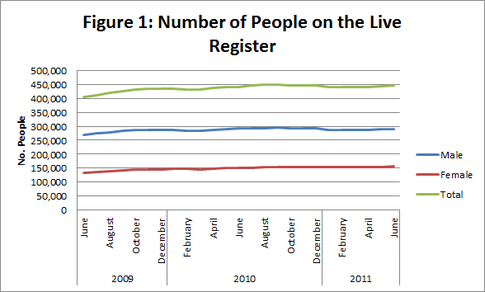
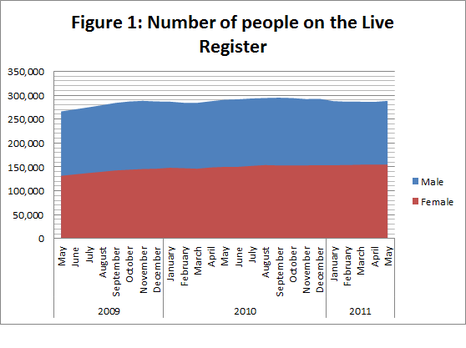
June has seen a slight increase in the number of people on the live register.  The total increase was 2,900 people, which is approximately an increase of 0.7%.  This is highlighted in Figure 1, with both the number of women and men signing onto the live register increasing.
Picture
0 Comments

GDP up in Q1 2011 but GNP down

6/23/2011

1 Comment

 
The latest figures from the CSO suggest that Irish GDP increased in the first quarter of 2011 by 1.3%.  However, GNP has fallen by 4.3%.  In comparison with the corresponding quarter of 2010, GDP was up by 0.1% while GNP was 0.9% lower.  The big difference between the increase in GDP and decrease in GNP is attributable to an increase in Net Factor Income.  GDP captures all economic activity within a country, including foreign multinational companies operating within Ireland.  GNP on the other had excludes foreign multinationals operating in Ireland which repatriate their income to their home country.  Therefore, GNP can be viewed as a more accurate measure of the health of a domestic economy.  Figure 1 displays the quarterly trend in GDP and GNP since 2006.
Picture
There has been a substantial gap between GDP and GNP since the Celtic Tiger period of Irish economic growth.  Q4 of 201 saw a narrowing of the gap between the two, however, it has now widened again considerably.  Figure 2 displays the ratio of GNP to GDP.
Picture
It can be observed that this ratio has been decreasing throughout the economic downturn, with some recovery in the final quarters of 2010.  However, Q1 of 2011 has reversed this recovery and suggests that the Irish domestic economy is underperforming.  It would appear to be multinational companies, as oppose to indigenous companies, which are driving the growth in Irish GDP.
1 Comment

House Prices Continue to Fall in May

6/22/2011

0 Comments

 
The latest figures from the CSO show that house prices have continued to fall in May 2011.  So far, in the year to May, prices have fallen by 12.2%.  In May itself, prices fell by 1.2%, up from a fall of 1% in April.  House Prices in Dublin are almost 46% lower than at their highest level in early 2007. Apartments in Dublin are 53% lower than they were in February 2007.
Picture
0 Comments

Imports Up but Exports Down in April

6/21/2011

0 Comments

 
Seasonally adjusted imports have increased by 32% from €3,712m in March 2011 to €4,914m in April 2011.  This is one of the largest increases in imports in recent months, as can be observed in Figure 1.  However, during the same time exports have decreased by 2%, from €7,718m to €7,530m.  This decline follows a similar decline for the period February to March.  As the Irish economy recovery has been mainly driven by export growth, these declining export figures are a worrying sign for the national economy.
Picture
0 Comments

EU Industrial Production Increasing

6/15/2011

1 Comment

 
Following on from last week’s post about an increase in Ireland’s industrial output, the EU areas industrial as a whole has also risen, perhaps being a positive sign for economic recovery to some extent.  Figure 1, taken from this Eurostat report, shows how, after substantial falls in 2008, industrial production is on the rise again.  The graph excludes the construction industry.  While figures for this industry are not available in the Eurostat report, it can be envisaged that had they been included the falloff in industrial production would have been substantially lower.  The recent recovery in industrial output has allowed the EU area to rise back to a little over 2005 level output.
Picture
1 Comment

Industrial Production Rising on Last Year

6/10/2011

1 Comment

 
In the year from April 2010 to April 2011 Industrial production increased by approximately 4%.  The Modern Sector which comprises the pharmaceutical and other high technology industries increased 2.6% while the Traditional sector recorded an increase of 1.4%.

Figure 1 displays the increase per quarter in the overall index of industrial production (with 2005 as the base year).  The CSO defines the industrial index as the “current trends in the volume of production of industrial local units with three or more persons engaged”.  It can be observed that over the last three years this has fallen from a peak in 2007 untilQ4 2009.  Following this industrial production saw a significant recovery, followed by a slight decline at the end of 2010.  
Picture
When we look at what sectors contributed to this decline and subsequent recovery, the CSO distinguishes between the Modern (High Technology) Sector and the Traditional (Low Technology) sectors.  We can see in Figure 2 that during the decline in 2008 and 2009, it was mainly a loss of production in the Traditional Sector as oppose to the Modern Sector which drove the steep falls.  While the recovery seems to be driven by a rise in the Modern Sector and simply a stabilisation in the Traditional Sector. 
Picture
While the rise of the Modern Sector is certainly good news, if we hope for an employment boost from this growth we may be disappointed.  Even though the Modern Sector produces more than the Traditional Sector, as of 2010, the Traditional Sector still employed more than twice the number of individuals as the Modern Sector.  So while the Modern sector would appear to be more productive (in terms of output per worker), growth in this sector may be more productivity driven as oppose to job creating.
Picture
1 Comment

Irish Consumer Sentiment on the Rise

6/8/2011

0 Comments

 
The month of May 2011 saw an increase in the consumer sentiment index operated by the ESRI and KBC Bank.  It has increased from 57.9 in April to 59.4 in May.  So far this year, apart from a dip in April, the consumer sentiment index has increased month on month from just 48.7 in January to 59.4 in May (it reached 59.5 in March but the fall in April reduced the index).  This suggests that consumers are starting to form a more positive outlook, but it is still very low compared to even the figures observed at the start of 2010.
Picture
The Consumer Sentiment Index is comprised of two sub-indices; an index of consumer expectation that focuses on how consumers view prospects over the next 12 months and an index of current economic conditions, focusing on the present situation.  There has been a decline in how the current economic conditions were viewed, with this falling from a figure of 81 in April to 72.1 in May.  But consumers are viewing the future prospects of the economy positively, being up from 42.3 in April to 50.8 in May.
Picture
Picture
0 Comments

Residential Property Prices Continue to Fall in April

6/7/2011

6 Comments

 
The latest report from the CSO indicate that house prices have again fallen in April.  Figure 1 shows the value of house prices using January 2005 as the base year.  Figure 2 plots the rate of the decline.  It can be seen that the rate of decline in house prices in 2011 so far is lower than that observed in 2009 but actually worse than that experienced in 2010.  
Picture
Picture
6 Comments

Ireland's Unemployment Rate 4th Highest in EU

6/3/2011

0 Comments

 
Following on from my post yesterday which showed Ireland’s unemployment rate had increased to 14.8% in May (which can be viewed here), a recent publication from Eurostat has shown that Ireland’s unemployment rate is the fourth highest in the EU.  Figure 1 shows how Ireland is only behind Spain (which has an unemployment rate of 20%), Lithuania and Latvia (both of whom have unemployment rates of above 17%) in terms of the highest unemployment rate.  This highlights the extent to which Ireland’s unemployment rate has climbed, from a mere 4% during the Celtic Tiger period.
Picture
0 Comments

Unemployment up again in May

6/2/2011

0 Comments

 
The standardised rate of unemployment has risen again in May 2011 to 14.8%, up from 14.7% in April 2011.  This increase is up from an average unemployment rate in 2010 of 13.6%.  An additional 2,600 individuals signed onto the live register in May (this figure is seasonally adjusted).  Of these 2,600 individuals at total of 2,200 were male and only 400 were female.  In total 100 men under the age of 25 actually signed off the live register in may while 100 women under the age of 25 signed on, meaning that there was no overall increase in the number of individuals under 25 signing on.  However, an additional 2,300 men over the age of 25 signed on while only an additional 300 women over the age of 25 signed on.
Picture
0 Comments

    Author

    Justin Doran is a Lecturer in Economics, in the Department of Economics, University College Cork, Ireland.

    Archives

    December 2017
    August 2013
    March 2013
    January 2013
    November 2012
    October 2012
    September 2012
    August 2012
    July 2012
    May 2012
    April 2012
    March 2012
    February 2012
    January 2012
    December 2011
    November 2011
    October 2011
    September 2011
    August 2011
    July 2011
    June 2011
    May 2011
    April 2011
    March 2011

    Categories

    All
    Competitiveness
    Conference Presentations
    Eu
    Europe
    Finance
    Government Intervention
    Innovation
    Ireland
    Macroeconomy
    Media (Radio/Newspaper)
    Publications
    Uk

    RSS Feed