|
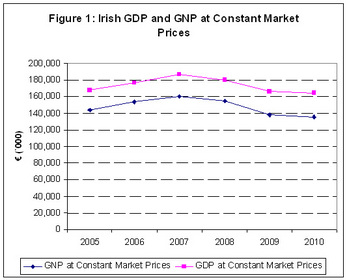
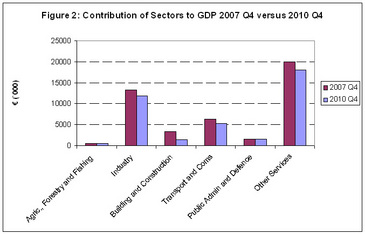
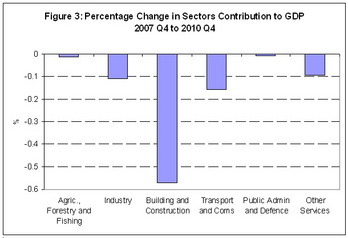
Preliminary figures from the CSO indicate that GDP and GNP in Ireland continued to fall in 2010. GDP contracted by 1% over the year while GNP fell by 2.1%. These falls are lower than the decline in 2009 and 2008 but are still worse than hoped for. Most forecasts at the beginning of the year predicted GDP to grow at a rate of 0% (i.e. show no change). Figure 1, however, clearly indicates the decline in both GDP and GNP. It can clearly be seen that since the peak in 2007, GDP has now fallen by 11.8% and GNP has fallen by 15.6%. If we break this change down by sector we can see the main factors driving this decline. Figure 2 presents the contribution of various sectors to total GDP. This graph compares Q4 2007 to Q4 2010. It can clearly be seen that all sectors are producing less output than previously with some sectors falling sharply and others contracting slightly. It must be noted when analysing the graph that Construction is a subset of industry, therefore, some of the fall in industry production can be explained by the fall in construction. When we consider in Figure 3 the percentage change between Q4 2007 and Q4 2010 we can see that the largest fall was observed in Construction, with output falling over 55%. While most other sectors experienced a fall of between approximately 10% and 15% with the one exception being agriculture which has seen a fall of only 1%. It can clearly be seen that while Construction has contributed significantly to the fall in the overall economy, it is far from the only sector experiencing dramatic decline.
0 Comments
Leave a Reply. |
AuthorJustin Doran is a Lecturer in Economics, in the Department of Economics, University College Cork, Ireland. Archives
December 2017
Categories
All
|


 RSS Feed
