SPSS Tutorial 7 - Implementing a t-test of Means
This test tests to see if there is a difference between two groups. For the grouping variable, you can choose a demographic trait (such as gender, age, ethnicity, etc) or any other variable that classifies your groups. (In an experimental design, it is a good way to test the differences between the control group and the manipulation group.) In this example, we’ll use gender.
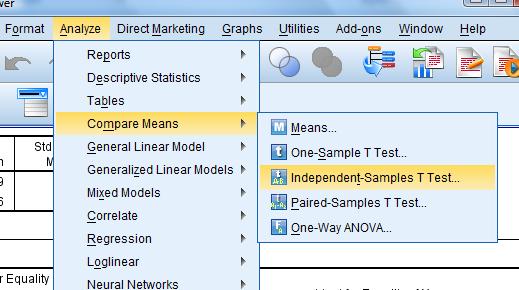
Analyze>Compare Means>Independent Samples T-test
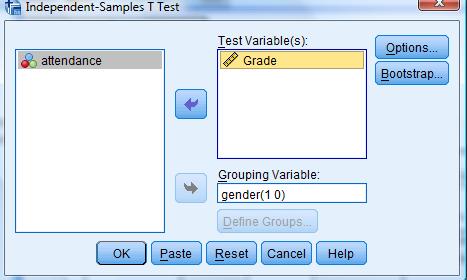
Select your Test variable from the list. This is the variable for which you want to compare means. In this example, we will test the variable “Average Grade”.
Now select the grouping variable, which is the trait you’re using to divide the groups. For this example, we will select gender. Select it from the list and click the arrow next to “Grouping Variable.”
Then, click “Define Groups …” and enter the values for the two groups. In this example, 1=Female and 2=Male.
Select “OK”, and you’ll get the output on the following page. You’ll notice that the means appear to be pretty close and the standard deviations are pretty close, too. So the means and distribution don’t appear to be different, but we need to test it statistically. This one is similar to the one-sample test, except first we have to test for equal variance.
Step One:Is there a difference in variance? If the Laverne’s Test is <.05, we assume unequal variances and go to the second line. Otherwise, variances are equal, so we use the top test.
Step Two: Is there a difference in means? If the significance of the t-test is <.05, there is a difference in means. If it is >.05, then the null hypothesis (no difference) is supported.


