SPSS Tutorial 6 - Implementing a Chi-squared Test
The chi-square test for independence, also called Pearson's chi-square test or the chi-square test of association, is used to discover if there is a relationship between two categorical variables.
When you choose to analyse your data using a chi-square test for independence, you need to make sure that the data you want to analyse "passes" two assumptions. You need to do this because it is only appropriate to use a chi-square test for independence if your data passes these two assumptions. If it does not, you cannot use a chi-square test for independence. These two assumptions are:
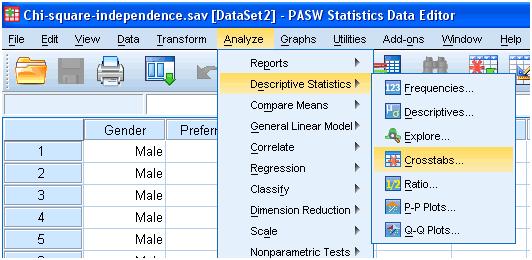
We will look at gender and attendance at lectures. In order to perform a Chi-squared test we must open the crosstab dialog box as follows:
When you choose to analyse your data using a chi-square test for independence, you need to make sure that the data you want to analyse "passes" two assumptions. You need to do this because it is only appropriate to use a chi-square test for independence if your data passes these two assumptions. If it does not, you cannot use a chi-square test for independence. These two assumptions are:
- Assumption #1: Your two variables should be measured at an ordinal or nominal level (i.e., categorical data). You can learn more about ordinal and nominal variables in our article.
- Assumption #2: Your two variable should consist of two or more categorical, independent groups. Example independent variables that meet this criterion include gender (2 groups: Males and Females), ethnicity (e.g., 3 groups: Caucasian, African American and Hispanic), physical activity level (e.g., 4 groups: sedentary, low, moderate and high), profession (e.g., 5 groups: surgeon, doctor, nurse, dentist, therapist), and so forth.
We will look at gender and attendance at lectures. In order to perform a Chi-squared test we must open the crosstab dialog box as follows:
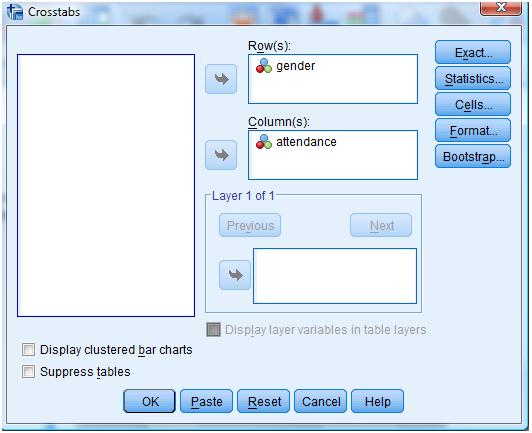
We now need to choose our variables as shown in Figure 2:
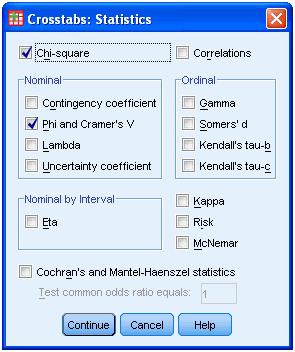
We now need to select the statistics option which opens a further dialog box allowing us to choose various options:
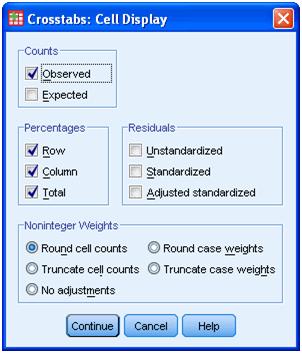
In this instance we will select the Chi-square statistic and the Phi and Cramer’s V option. We now click continue. Following this we select the Cells option and this opens the following dialog box:
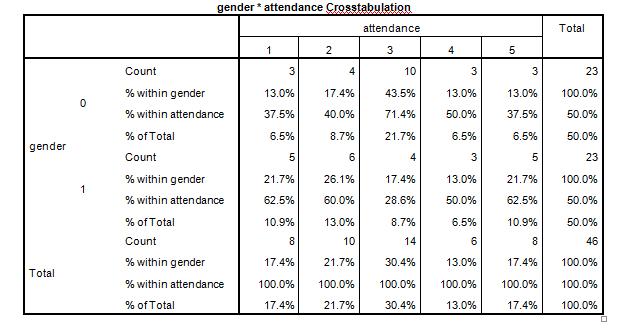
We wish to select the observed option and also want to calculate the percentages for the rows, columns and total. This produces the following output:
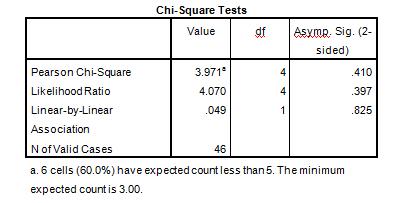
This table allows us to understand that both males and females attendance at lectures varies. The Chi-squared test gives us:
When reading this table we are interested in the results for the Continuity correction. We can see here that χ(1) = 3.971, p = 0.410. This tells us that there is no statistically significant association between Gender and Preferred Learning Medium. That is, both Males and Females equally prefer online learning vs. books.
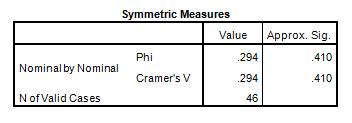
Phi and Cramer's V are both tests of the strength of association. We can see that the strength of association between the variables is very weak. We can observe this based on the sig. values.
