SPSS Tutorial 5 - Generating Crosstabs
When we have categorical data it can be interesting to begin the analysis by using crosstabs. For example if we have two variables; gender and attendance. We can assess whether there are differences between the variables and also whether gender has an impact on the likelihood of attendance.
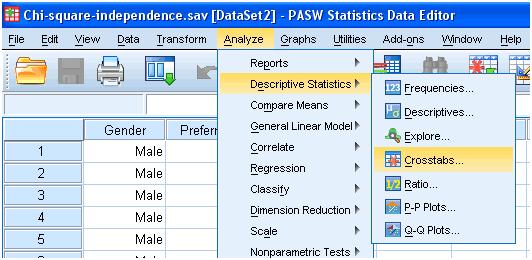
Cross tabulation is a way to examine the relationship between two variables. In SPSS, you can access cross tabs using the following:
Analyze > Descriptive Statistics > Crosstabs…
In other words, click on Analyze in the menu bar, select Descriptive Statistics, then Crosstabs…
This brings up the crosstab dialog box displayed in Figure 1 below:
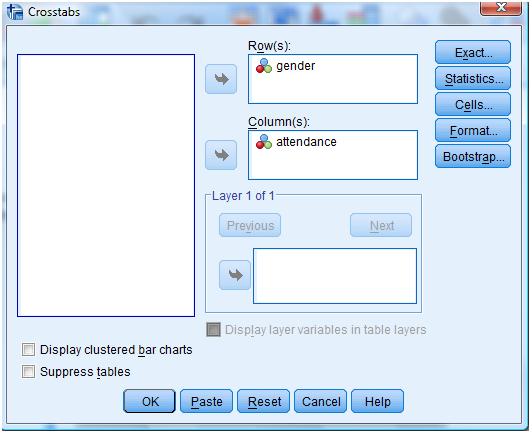
Once we have opened the crosstab dialog box find and move the independent and dependent variable to Column(s): and Row(s): boxes, respectively. In this case, the independent variable [gender] goes to Column(s): box and the dependent variable [attend] goes to Row(s): box. This is displayed in Figure 2:
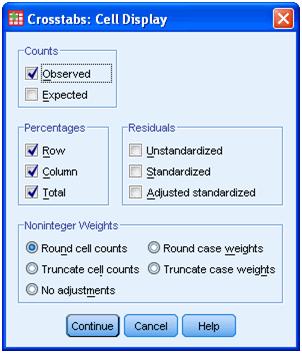
In the Cell Display window, select the Column in the Percentages section. It allows you to have percentage value separately calculated for each category of the independent variable. Make sure that Observed was selected in the Counts section although it should be checked by default. This is displayed in Figure 3:
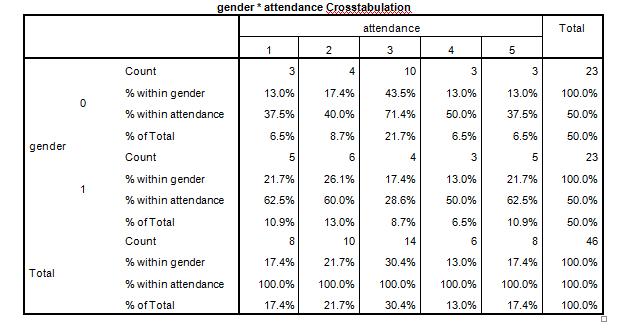
Click on Continue and OK buttons to see the cross tabulation. This generates the output displayed in Figure 4. The output
displays two tables, one for case processing summary and the other for cross
tabulation of the two variables. Notice that [sex] is on the column and
[attend] is on the row of the cross tabulation as we assigned.